Linked Animal-Human Health Visual Analytics (LAHVA) Expansion
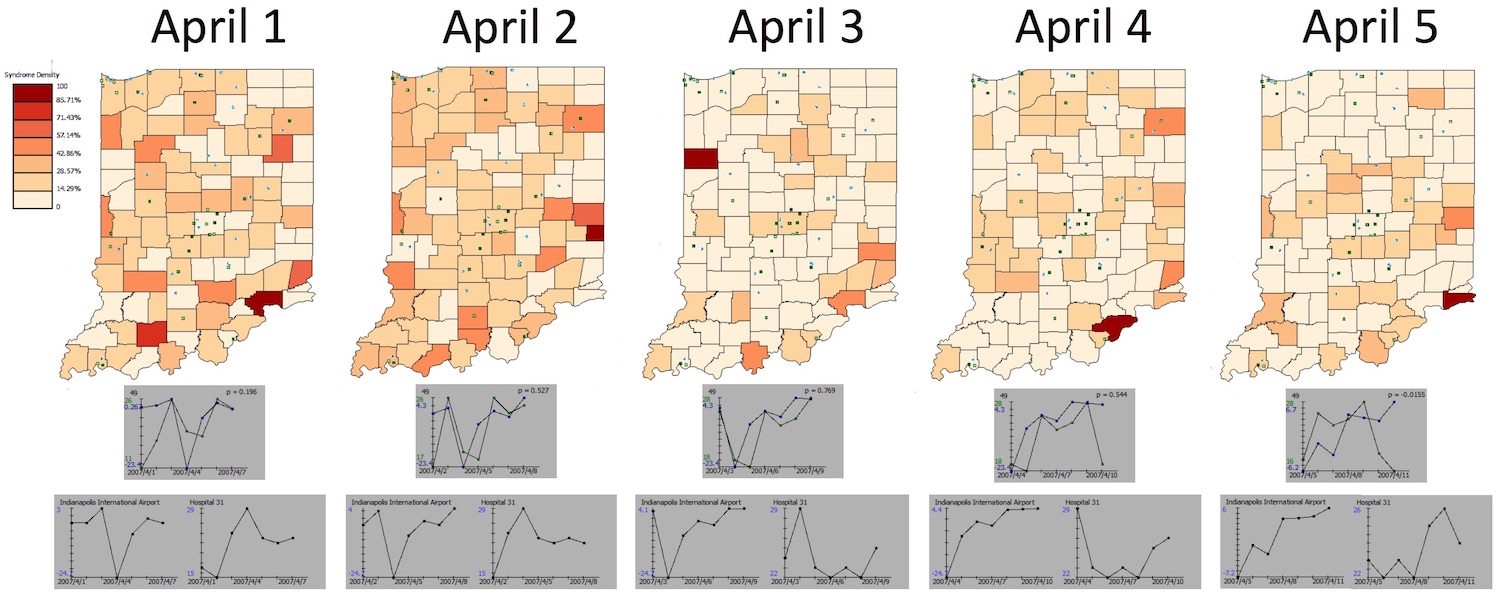
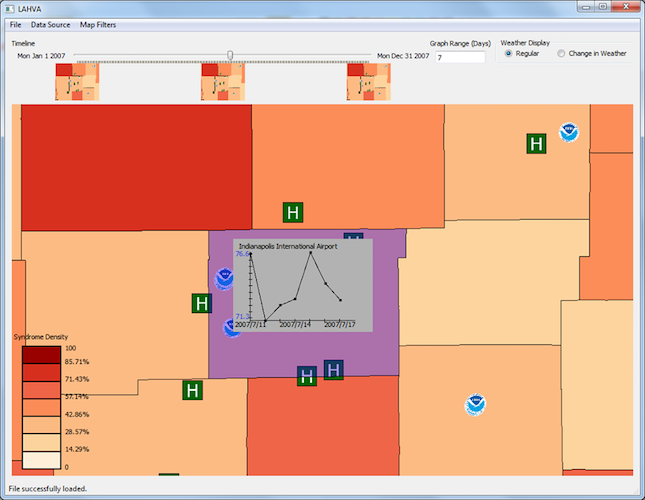
Fri, Apr 26, 2013This application was developed for the Spring 2013 Fulton Undergraduate Research Initiative (FURI). The application allowed users to load a health and weather data set to display graphically on a map. The map displayed the counties for a country and changed the color of a county based on the number of health incidents. The user could change the the health condition (such as gastrointestinal problems) or the weather condition (such as temperature). Once the data fields were selected, the data was displayed on the map and the user could hover over a county to display a graph correlating the selected health condition to the selected weather condition.
I extended previous work that developed the base structure of the application and computed the weather and health correlations. My contributions and results from the project include:
- Modify the graph display to display the actual weather values or the change in weather values.
- Plot weather station locations on the map.
- Enabling the user to change the date range to recalculate the weather and health correlations.
- Graphing healthy symptoms over a time period (default: 7 days).
- Modify the weather/health correlation calculations to be multi-threaded. Increased calculation times by ~33%.
- Calculate Pearson’s coefficient to provide a mathematical correlation for the weather/health correlation graph.
- Presented research at the Spring 2013 FURI Symposium.
Screenshots
LAHVA Application Screenshot
LAHVA Change Over Week